The Pipeline
This project combines historical price data with hand-built technical indicators and sentiment scores extracted from SEC filings and news articles. By integrating multiple data streamsâmarket structure, derived features, and natural language signalsâwe explore whether machine learning models can learn patterns that traditional econometric methods miss.
Assets & Horizon
Daily OHLCV (Open, High, Low, Close, Volume) data combined with hand-built technical indicators and sentiment scores from SEC filings and financial news sources.
Feature Engineering
- SMA, EMA, MACD
- RSI, Bollinger Bands
- Sentiment scores
Models
- ARIMA baseline
- LSTM regressor
- Transformer regressor
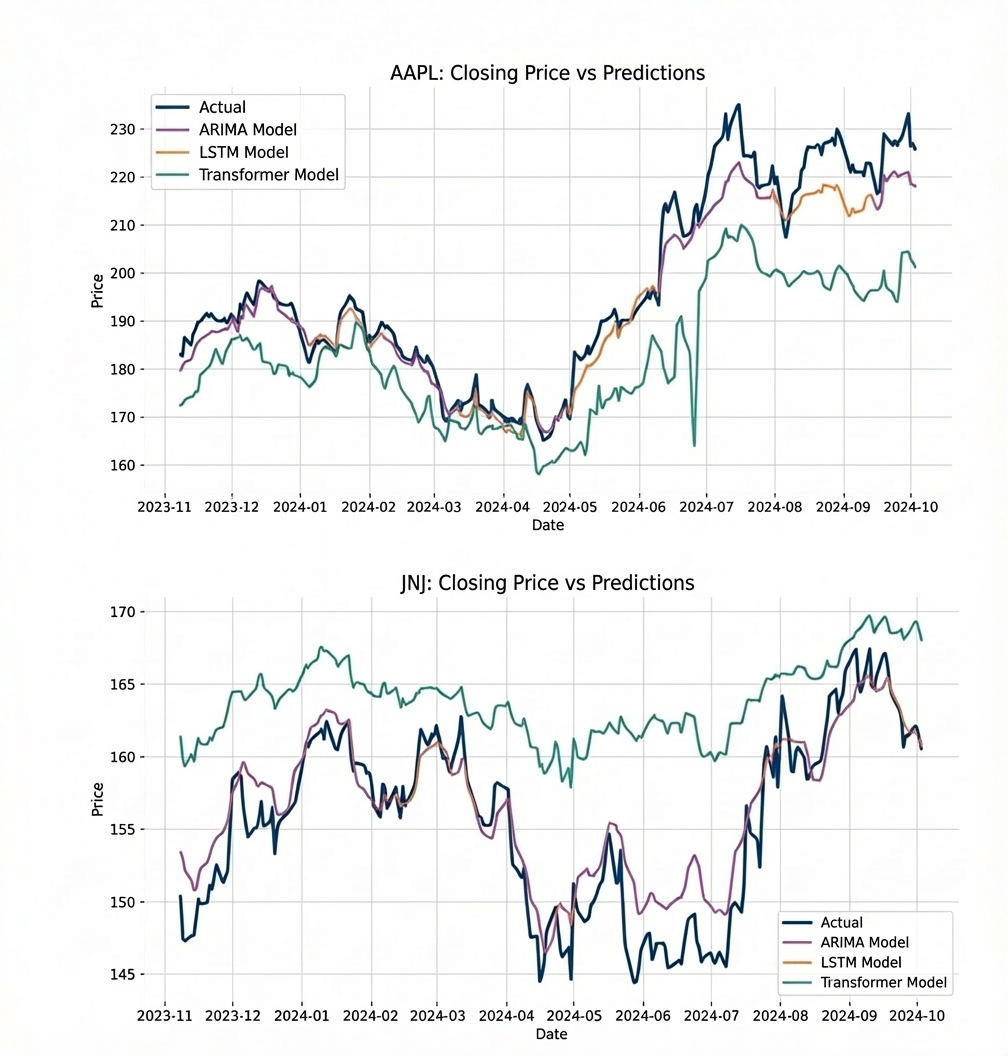
Results
LSTM Performance
The LSTM regressor demonstrated strong predictive capability, tracking both trend direction and local price swings across different equity series.
Key Findings
The LSTM learns to follow rallies, drawdowns, and sideways ranges where sentiment features provide additional signal that ARIMA baselines never capture. This suggests that deep learning architectures can effectively integrate heterogeneous data sourcesânumerical indicators and text-derived featuresâto improve market forecasts.